Graphing Window and XY-Axis#
Python allows multiple graphing components to be added to a single graphing window. We can add titles, legends, and multiple functions. Python will display them as a single graph.
The code below sets up Python and loads the packages we need.
## Do not change this cell, only execute it.
## This cell initializes Python so that pandas, numpy and scipy packages are ready to use.

%matplotlib inline
import matplotlib.pyplot as plots
plots.style.use('fivethirtyeight')
import numpy as np
import scipy as sp
from scipy.optimize import linprog
Graphing Window#
1. Creating and Sizing the Graphics Window#
Let’s starts with creating the canvas on which we will paint some graphics. The graphing window is set using the following command:
We utilize the figsize option to create a rectangle. In the example below, our window will be 5 inches by 5 inches:
Please note that you may change the figsize option depending upon your screen and your browser. Typically, the size we need will range between \((5,5)\) and \((8,8)\). We can use non-square graphical windows as needed.
2. Setting the Ranges on the xy-Axes#
We will use the plots.xlim function together with the plots.ylim function to set the range of the \(x\)-axis and \(y\)-axis that will be visible inside the graphing window. The commands needed are shown below:
The lower bound must be less than 0. Yet, if the lower bound is an integer, the labeling of the x-axis and y-axis will overlap awkwardly in the bottom-left of the graphics window. That is why we chose to use $\(\textbf{Lower Bound } = -0.5\)$ in both cases.
3. Creating the xy-Coordinate Axes#
We will use the 2 functions shown below:
axhline creates a horizontal line – our \(x\)-axis.
axvline creates a vertical line – our \(y\)-axis.
Both of these functions will need three options specified as follows:
First option: 0 , the \(x\)-value of the vertical line or \(y\)-value of the horizontal line.
Second option: color=’black’ , vary as needed.
Third option: linewidth=1 , vary as needed but will rarely need to be more than 1.25.
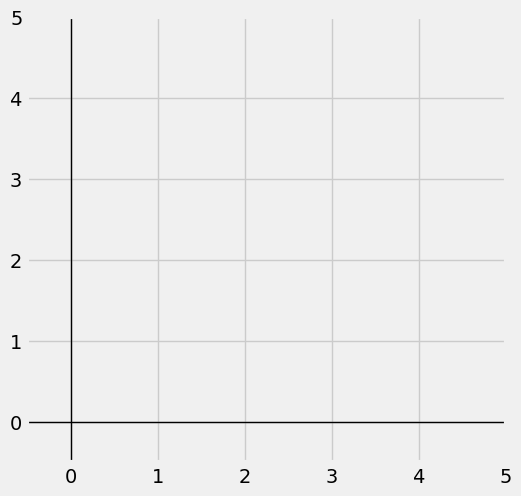
Putting it all Together#
# Create and size graphics window:
plots.figure(figsize=(5.5, 5.5))

# Create the XY-axis through origin:
plots.axhline(0, color='black', linewidth=1)
plots.axvline(0, color='black', linewidth=1)

# Set range for axes:
plots.xlim(-0.5, 5)
plots.ylim(-0.5, 5)

# Show the plot
plots.show()