Polygons#
We will need to graph payoff polygons in this course which, generally speaking, will require creating a polygon which lives mostly in the first quadrant.
## Do not change this cell, only execute it.
## This cell initializes Python so that pandas, numpy and scipy packages are ready to use.

%matplotlib inline
import matplotlib.pyplot as plots
plots.style.use('fivethirtyeight')
import numpy as np
import scipy as sp
from scipy.optimize import linprog
Drawing a Polygon#
To define the \(x\)-coordinates and \(y\)-coordinates of the vertices of the polygon, we create lists as follows:
x = [ 1 , 3 , 2 ]
y = [ 2 , 1 , 5 ]
The points \((1,2)\), \((3,1)\), and \((2,5)\) would be the vertices of the polygon in the example above. We must list all the \(x\)-coordinates together and all the \(y\)-coordinates together.
To create the interior of the polygon, we use the function plots.fill() as it will connect the last vertex to the first, closing the figure, as shown below:
Note the option in the fill function: if we insert alpha=0.5, we control the transparency of the interior color allowing us to see through the figure to the grid behind it. Values for this parameter must be \(\alpha \in [0,1]\).
Adding dots at the vertices for clarity:
Example#
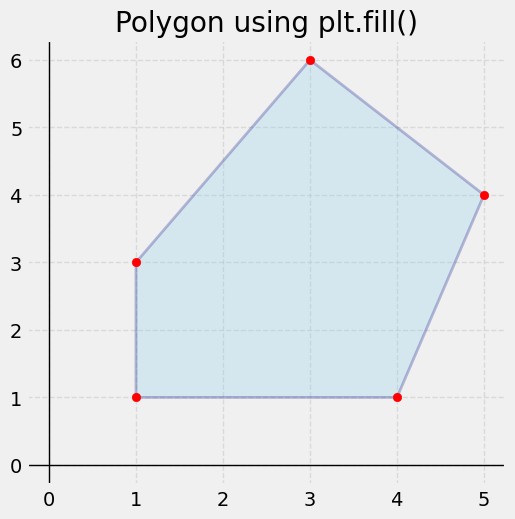
Let’s put together an example showing a polygon that has as its vertices the points \((1,1)\), \((4,1)\), \((5,4)\), \((3,6)\), and \((1,3)\). Note how we pick the colors for the interior of the polygon and its edges along with the transparency setting (alpha), width of the lines, and the line style.
plots.figure(figsize=(5.5, 5.5))
plots.axhline(0, color='black', linewidth=1)
plots.axvline(0, color='black', linewidth=1)
x = [1, 4, 5, 3, 1]
y = [1, 1, 4, 6, 3]

plots.fill(x, y, color="skyblue", edgecolor="navy", linewidth=2, alpha=0.25)
plots.scatter(x, y, color="red", zorder=5)

plots.title("Polygon using plt.fill()")
plots.grid(True, linestyle='--', alpha=0.6)
plots.show()