Horiztonal and Vertical Lines#
Often in game theory, we wish to add vertical or horizontal lines to our graphics, for example, when we find the players’ security levels.
## Do not change this cell, only execute it.
## This cell initializes Python so that pandas, numpy and scipy packages are ready to use.

%matplotlib inline
import matplotlib.pyplot as plots
plots.style.use('fivethirtyeight')
import numpy as np
import scipy as sp
from scipy.optimize import linprog
Vertical Lines#
The function we use to create vertical lines is in the matplotlib package which have imported above as plots. The correct function title is shown below:
The correct function call is shown first with its options shown below:
With \(x=1\), we place the vertical line through the desired point on the \(x\)-axis.
We can specify the color as needed.
With linestyle, we can specify a dashed line.
Horizontal Lines#
The function plots.axhline() works in exactly the same way to create a horizontal line.
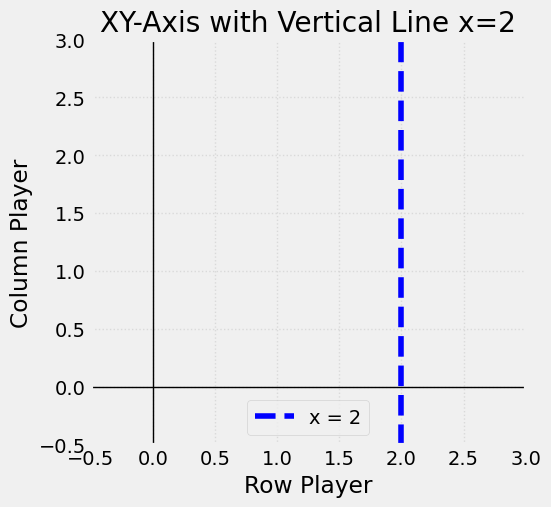
Putting it All Together#
The command cell below includes the XY-axis and graphing window options from the previous section. You should note that we have added a title to the graph, labels for the \(x\)-axis and \(y\)-axis, and a legend.
# Create the plot with overall size specified
plots.figure(figsize=(5, 5))
plots.xlim(-0.5, 3)
plots.ylim(-0.5, 3)
plots.axhline(0, color='black', linewidth=1)
plots.axvline(0, color='black', linewidth=1)

# Draw a dotted vertical line at x = 2
plots.axvline(x=2, color='blue', linestyle='--', label='x = 2')

# Adding labels and a grid for clarity
plots.xlabel('Row Player')
plots.ylabel('Column Player')
plots.title('XY-Axis with Vertical Line x=2')
plots.grid(True, linestyle=':', alpha=0.6)
plots.legend()

plots.show()