Finding Intersection of 2 Lines#
We learned to plot a line through 2 points, and we can draw multiple lines in python. How do we solve for the intersection point of the lines?
## Do not change this cell, only execute it.
## This cell initializes Python so that pandas, numpy and scipy packages are ready to use.

%matplotlib inline
import matplotlib.pyplot as plots
plots.style.use('fivethirtyeight')
import numpy as np
import scipy as sp
from fractions import Fraction
from scipy.optimize import linprog
Mathematics#
Suppose we have two lines in slope-intercept form:
\(y = m_1 x + b_1\)
\(y = m_2 x + b_2\)
To find the intersection point, we set \(y=y\) and simplify as follows:
We gather like terms with \(m_1,m_2\) to the left side and \(b_1,b_2\) to the right:
Next, we factor on the left:
Finally, we divide through by the coefficient of \(x\), and we have the following (switching to \(x_0\) to indicate the specific \(x\)-value of the intersection point):
To solve for \(y_0\), we use the first line above which has sloped \(m_1\) and intercept \(b_1\):
Thus, the point
will be the intersection of the two lines provided they actually intersect.
Code#
To create the code we need, recall that we defined the points in our graphics as follows:
points = ((1, 4), (5, 3))
and
points2 = ( (2, 1) , (5, 5) )
We first define a function get_slop-int() that will take the coordinates of two points as inputs and will caluclate the slope and \(y\)-intercept.
def get_slope_int(p1, p2):
    m = (p2[1] - p1[1]) / (p2[0] - p1[0])
    b = p1[1] - m * p1[0]
    return m, b
Now that python know the function, we need to remind it of the points:
points = ((1, 4), (5, 3))
points2 = ( (2, 1) , (5, 5) )
We calculate the slope and intercept for the first line as follows:
m1, b1 = get_slope_int(points[0], points[1])
We calculate the slope and intercept for the second line as follows:
m2, b2 = get_slope_int(points2[0], points2[1])
Knowing the values \(\left\{m_1,m_2,b_1,b_2\right\}\), we perform the calculation derived in the section above.
x_0 = (b2 - b1) / (m1 - m2)
y_0 = m1 * x_0 + b1
print(f"The two lines intersect at the point: ({round(x_0,4)}, {round(y_0,4)})")
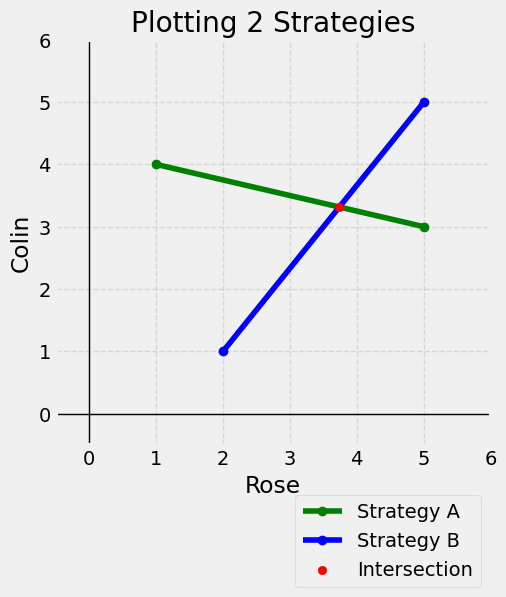
The two lines intersect at the point: (3.7368, 3.3158)
We can add these calculations to our graphics where we plotted the two lines. The result will look like thise.
plots.figure(figsize=(5,5))
plots.axhline(0, color='black', linewidth=1)
plots.axvline(0, color='black', linewidth=1)
plots.xlim(-0.5, 6); plots.ylim(-0.5, 6)

points = ((1, 4), (5, 3))
plots.plot(*zip(*points), marker='o', color='green', label='Strategy A')
points2 = ( (2, 1) , (5, 5) )
plots.plot(*zip(*points2), marker='o', color='blue', label='Strategy B')

m1, b1 = get_slope_int(points[0], points[1])
m2, b2 = get_slope_int(points2[0], points2[1])
x_0 = (b2 - b1) / (m1 - m2)
y_0 = m1 * x_0 + b1
plots.scatter(x_0, y_0, color='red',label='Intersection', zorder=3)

# Add labels and title
plots.xlabel('Rose')
plots.ylabel('Colin')
plots.title('Plotting 2 Strategies')

# Add a grid, add legend, and place legend below figure.
plots.grid(True, linestyle='--', alpha=0.7)
plots.legend(loc='upper right', bbox_to_anchor=(1, -0.1),framealpha=0.75)
plots.show()
Rationalize Values#
When python calculates a value, we can force it to remain in exact value mode and produce, where possible, the improper fraction. The code to do this involves the package
Notice how, in the code below, we can rationalize the values \((x_0, y_0)\) using the Fraction() function. Rather than a decimal approximation, we retrieve the improper fraction which will often be more helpful in game theory settings.
points = ((1, 4), (5, 3))
points2 = ( (2, 1) , (5, 5) )

m1, b1 = get_slope_int(points[0], points[1])
m2, b2 = get_slope_int(points2[0], points2[1])
x_0 = (b2 - b1) / (m1 - m2)
y_0 = m1 * x_0 + b1

# Rationalize the values
rx = Fraction(x_0).limit_denominator()
ry = Fraction(y_0).limit_denominator()

print(rx, ry)
71/19 63/19
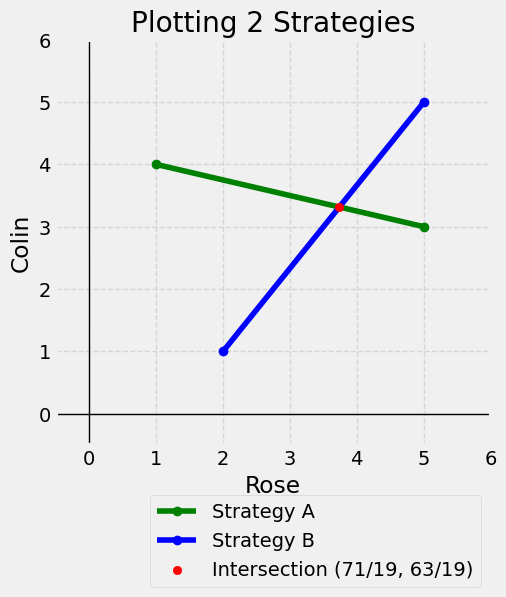
Final Example: Rationalized Intersection with Updated Label#
We can add the rationalized coordinates of the point of intersection into our label and legend with the command:
label=f'Intersection ({rx}, {ry})'
Gathering all of the above information, the final graphic of two lines intersecting with the intersection point solved for, rationalized and printed would look like this.
plots.figure(figsize=(5,5))
plots.axhline(0, color='black', linewidth=1)
plots.axvline(0, color='black', linewidth=1)
plots.xlim(-0.5, 6); plots.ylim(-0.5, 6)

points = ((1, 4), (5, 3))
plots.plot(*zip(*points), marker='o', color='green', label='Strategy A')
points2 = ( (2, 1) , (5, 5) )
plots.plot(*zip(*points2), marker='o', color='blue', label='Strategy B')

m1, b1 = get_slope_int(points[0], points[1])
m2, b2 = get_slope_int(points2[0], points2[1])
x_0 = (b2 - b1) / (m1 - m2)
y_0 = m1 * x_0 + b1

# Rationalize the values
rx = Fraction(x_0).limit_denominator()
ry = Fraction(y_0).limit_denominator()
plots.scatter(x_0, y_0, color='red', label=f'Intersection ({rx}, {ry})', zorder=3)

plots.xlabel('Rose')
plots.ylabel('Colin')
plots.title('Plotting 2 Strategies')
plots.grid(True, linestyle='--', alpha=0.7)
plots.legend(loc='upper right', bbox_to_anchor=(1, -0.1),framealpha=0.75)
plots.show()