27. Correlation and Regression
from datascience import *
import numpy as np

%matplotlib inline

import matplotlib.pyplot as plots
plots.style.use('fivethirtyeight')

from scipy import stats
I keep some data frames in CSV format accessible from my website. One of them is called personality.csv and has, as you might imagine, personality variables. In this case, we are using the neuroanx subset which compares neuroticism, anxiety and several related variables:
- G21
Y/N response to “are you 21 years old or older?”
- SitClass
Front/middle/back response to “where do you prefer to sit in class?”
- Friends
Same/opposite/no difference response to “which sex do you find it easiest to make friends with.”
- TxRel
Toxic relationships beliefs, higher scores indicate more toxicity.
- Opt
Optimism, higher scores indicate more optimism
- SE
Self-esteem, higher score indicate higher levels of self-esteem
Correlation
When two numeric variables are associated, we say they are correlated. However, just as association does not imply causation, neither does correlation.
We have three valuable functions that we can use to investigate the linear correlation of two variables. Similar to A/B testing, we can randomly shuffle the \(y\)-variable to test whether the correlation between \(x\) and \(y\) is significant.
reg_rreg_statreg_shuffle
The input for all three functions is a two-column table with two numeric variables, the \(x\)-variable in the first column and \(y\)-variable in the second.
The reg_r function returns the correlation of two variables and requires the z_scores function to run properly. The reg_stat function produces regression statistics and a scatter plot. The reg_shuffle functions like the ab_shuffle function and allows us to simulate the null hypothesis in a test of significant correlation.
def reg_r (tab):
    x = tab.column(0)
    y = tab.column(1)
    return sum(z_scores(x)*z_scores(y))/(tab.num_rows - 1)
def z_scores(array):
    mean = np.mean(array)
    sd = np.std(array)
    return (array - mean) / sd
def reg_stat (tab):
    x = tab.column(0)
    y = tab.column(1)
    r = sum(z_scores(x)*z_scores(y))/(tab.num_rows - 1)
    b = r * np.std(y) / np.std(x)
    a = np.mean(y) - b * np.mean(x)
    print('The correlation is ', r)
    print('The line of best fit is y =',round(a,4), '+',round(b,4),'x')
    tab.scatter(0,1, fit_line = True)
def reg_shuffle(tab):
    shuffled_y = tab.sample(with_replacement = False).column(1)
    shuffled_tab = tab.with_column("Shuffled Y",shuffled_y).select(0,2)
    return shuffled_tab
def reg_hist(myArray, observed_value):
    tab = Table().with_column('Simulated Correlation',myArray)
    tab.hist(0)
    _ = plots.plot([observed_value, observed_value], [0, 1], color='red', lw=2)
Data for examples
pers = Table.read_table('http://faculty.ung.edu/rsinn/neuroanx.csv')
pers.show(5)
| Sex | G21 | SitClass | Friends | TxRel | Anx | Opt | SE | Neuro |
|---|---|---|---|---|---|---|---|---|
| M | N | F | O | 26 | 23 | 20 | 70 | 10 |
| F | N | M | S | 21 | 24 | 22 | 68 | 11 |
| M | Y | F | E | 25 | 27 | 29 | 65 | 11 |
| M | Y | B | E | 22 | 30 | 28 | 61 | 15 |
| M | N | M | E | 23 | 40 | 26 | 64 | 16 |
... (137 rows omitted)
neuroanx = pers.select('Neuro','Anx')
neuroanx.show(5)
| Neuro | Anx |
|---|---|
| 10 | 23 |
| 11 | 24 |
| 11 | 27 |
| 15 | 30 |
| 16 | 40 |
... (137 rows omitted)
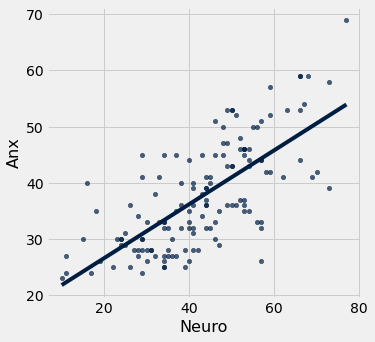
Example 1: Neuroticism vs. Anxiety
Let’s first check the association between the variables and set the correlation to obs_r
obs_cor = reg_r(neuroanx)
obs_cor
0.7140323446533897
reg_stat(neuroanx)
The correlation is  0.7140323446533897
The line of best fit is y = 16.8451 + 0.4833 x
We can test the null hypothesis that there is zero correlation and determine the probability of seeing this pattern in the results by random chance. To determine a single value of this statistic, we find the correlation of the two variables after a random reshuffling of the \(y\)-variable.
new_cor = reg_r(reg_shuffle(neuroanx))
new_cor
-0.05792472806957106
shuff_cor = make_array()

reps = 1000

for i in range(reps):
    new_cor = reg_r(reg_shuffle(neuroanx))
    shuff_cor = np.append(shuff_cor, new_cor)
# Remove hashtag comment to see the shuff_cor results array
# shuff_cor
reg_hist(shuff_cor, obs_cor)
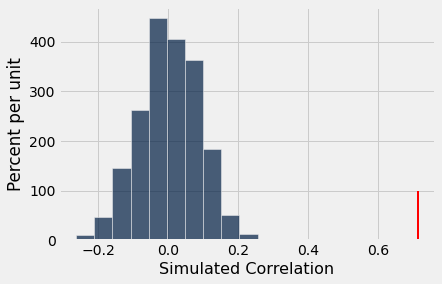
p_value = sum( shuff_cor >= obs_cor ) / reps
p_value
0.0
# Test for a significant correlation between
# Neuroticism and Toxic Relationship Beliefs (TxRel).

...
Ellipsis