For Loops in R#
We don’t need much programming skill to use R effectively for statistics and probability, but a little bit helps. The for loop is quite helpful to generate probability distributions and investigate their properties.
Simple For Loop#
To see the basic features and requirements of a for loop, consider the following:
for (x in 1:7) {
  print(x)
}
[1] 1
[1] 2
[1] 3
[1] 4
[1] 5
[1] 6
[1] 7
Note that we have the following requirements:
An indexing variable (in this case \(x\)) that takes on each value from 1 to 7.
Brackets {} enclose the loop, e.g. the function(s) that need to be run repeatedly.
Function rflip#
The function rflip() simulates coin flips or, more generally, the binomial distribution. We can use this function to great effect, and the cell below will load it into active memory for this notebook.
Show code cell source
rflip <- function(n=1, prob=.5, quiet=FALSE, verbose = !quiet, summarize = FALSE,
                  summarise = summarize) {
	if ( ( prob > 1 && is.integer(prob) ) ) {
		# swap n and prob
		temp <- prob
		prob <- n
		n <- temp
	}
	if (summarise) {
	  heads <- rbinom(1, n, prob)
	  return(data.frame(n = n, heads = heads, tails = n - heads, prob = prob))
	} else {
	  r <- rbinom(n,1,prob)
	  result <- c('T','H')[ 1 + r ]
	  heads <- sum(r)
	  attr(heads,"n") <- n
	  attr(heads,"prob") <- prob
	  attr(heads,"sequence") <- result
	  attr(heads,"verbose") <- verbose
	  class(heads) <- 'cointoss'
	  return(heads)
	}
}
Examples with rflip() Function#
A few examples will help show why we imported the code for this function:
Basic Function for 20 Flips: Verbose Output#
rflip(20, prob = 1/4)
[1] 3
attr(,"n")
[1] 20
attr(,"prob")
[1] 0.25
attr(,"sequence")
 [1] "T" "T" "T" "T" "H" "T" "T" "T" "H" "T" "T" "T" "T" "T" "T" "T" "T" "T" "H"
[20] "T"
attr(,"verbose")
[1] TRUE
attr(,"class")
[1] "cointoss"
Function Call for 20 Flips: Summary Output#
Hint
Note that heads is synnomous with successes in the summary.
rflip(20, prob = 1/4, summarize = TRUE)
| n | heads | tails | prob |
|---|---|---|---|
| 20 | 7 | 13 | 0.25 |
Extracting Number of Successes from Summary Output#
rflip(20, prob = 1/4, summarize = TRUE)[1,2]
Example 2: For Loop with rflip() Function#
We wish to flip 20 coins each with a 25% chance of success. We use the FOR LOOP to repeat this a thousand times.
num_success <- c()       # create a vector to store the number of successes for each sample drawn
num_reps = 1000          # set the number of times to run the FOR LOOP

for (i in 1:num_reps){
    temp <- rflip(20, prob = 1/4, summarize = TRUE)[1,2]  # flip 20 coins, count numer of successes (heads)
    num_success[i] <- temp     # count and store the number of successes from this trial
}

head(num_success, 12)        # display results of first 20 trials
- 5
- 5
- 5
- 3
- 4
- 7
- 7
- 2
- 6
- 5
- 6
- 6
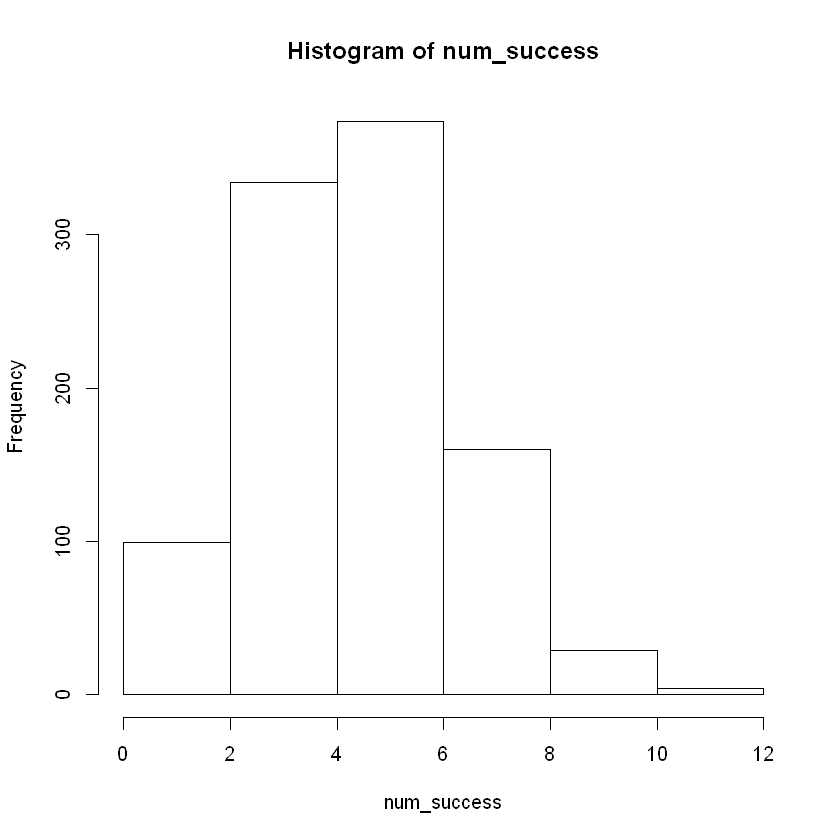
We can create a histogram of the results to see the shape of the distribution.
num_success <- c()       # create a vector to store the number of successes for each sample drawn
num_reps = 1000          # set the number of times to run the FOR LOOP

for (i in 1:num_reps){
    temp <- rflip(20, prob = 1/4, summarize = TRUE)[1,2]  # flip 20 coins, count numer of successes (heads)
    num_success[i] <- temp     # count and store the number of successes from this trial
}

hist(num_success, breaks = 8)     # display histogram of results from all trials
Example 3: Add Lines on Histogram Displaying Middle 90%#
num_success <- c()       # create a vector to store the number of successes for each sample drawn
num_reps = 1000          # set the number of times to run the FOR LOOP

for (i in 1:num_reps){
    temp <- rflip(20, prob = 1/4, summarize = TRUE)[1,2]  # flip 20 coins, count numer of successes (heads)
    num_success[i] <- temp     # count and store the number of successes from this trial
}

lower <- quantile(num_success, prob = 0.05)     # Calcuate the 5th percentile.
upper <- quantile(num_success, prob = 0.95)     # Calcuate the 95th percentile.
hist(num_success, breaks = 8)
abline( v = lower, col="blue")
abline(v = upper, col="blue")
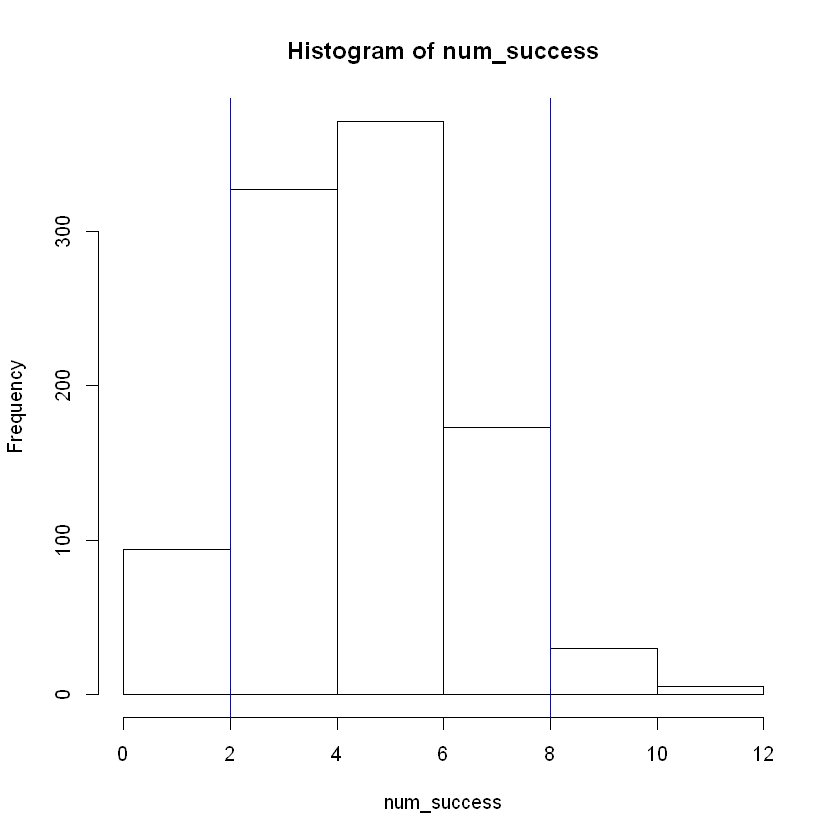
Results#
We can see that the middle 90% of the data fall roughly between 2 and 9, or in terms of intervals:
Example 4: Increasing Number of Repetitions to 100,000#
num_success <- c()       # create a vector to store the number of successes for each sample drawn
num_reps = 100000          # set the number of times to run the FOR LOOP

for (i in 1:num_reps){
    temp <- rflip(20, prob = 1/4, summarize = TRUE)[1,2]  # flip 20 coins, count numer of successes (heads)
    num_success[i] <- temp     # count and store the number of successes from this trial
}

lower <- quantile(num_success, prob = 0.05)     # Calcuate the 5th percentile.
upper <- quantile(num_success, prob = 0.95)     # Calcuate the 95th percentile.
hist(num_success, breaks = 8)
abline( v = lower, col="blue")
abline(v = upper, col="blue")
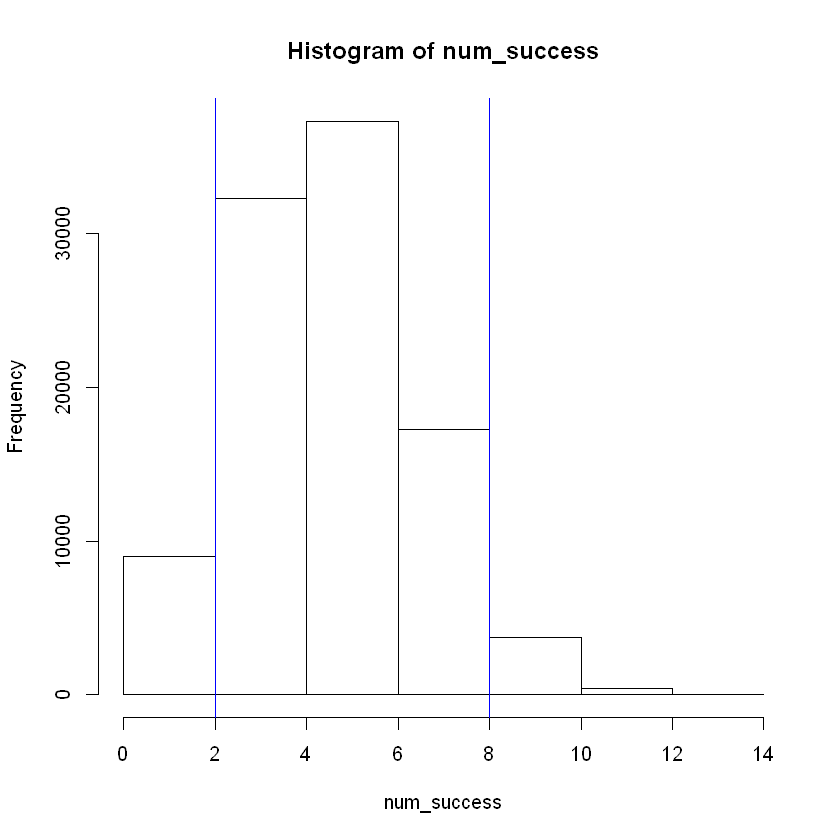
Results#
The interval has narrowed due to increased repetitions as predicted by the Law of Large numbers. The new interval is as follows: